Bridges Outcomes Partnerships
Overview
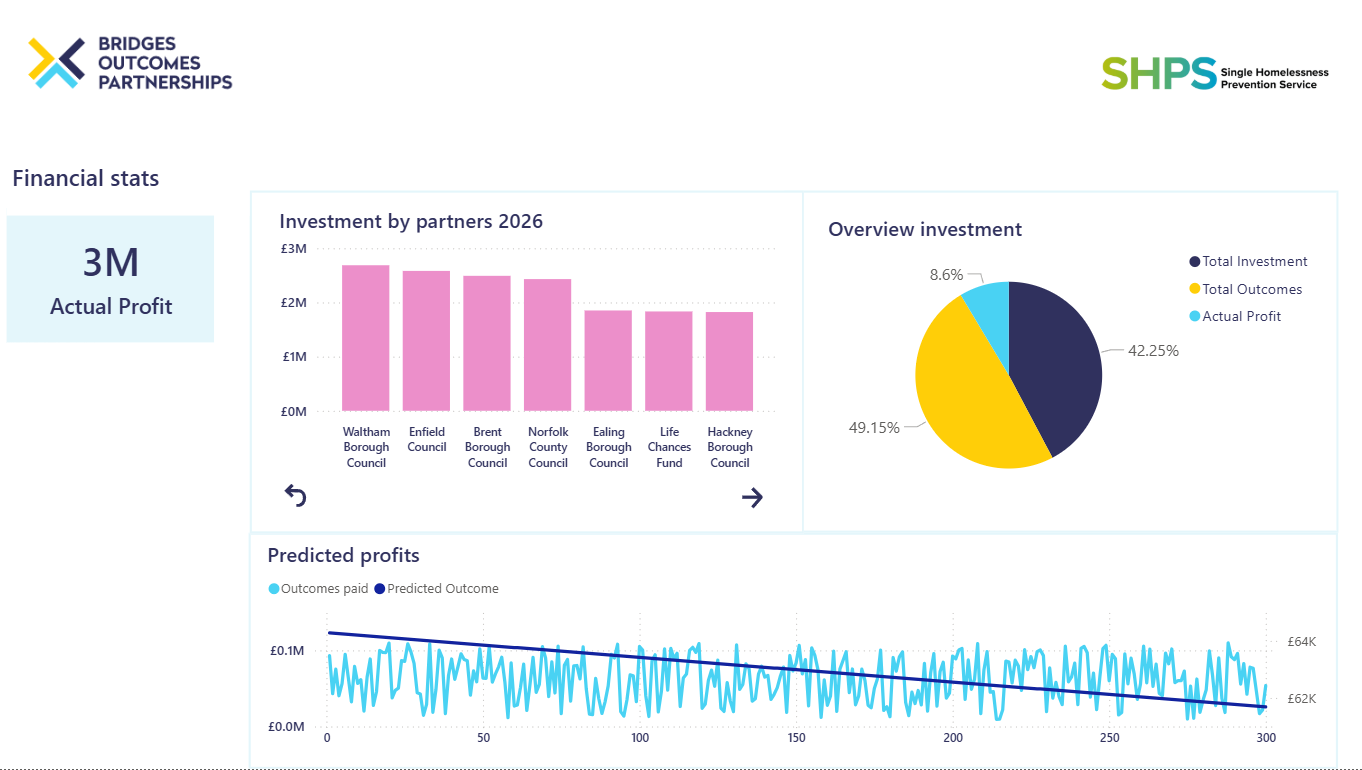
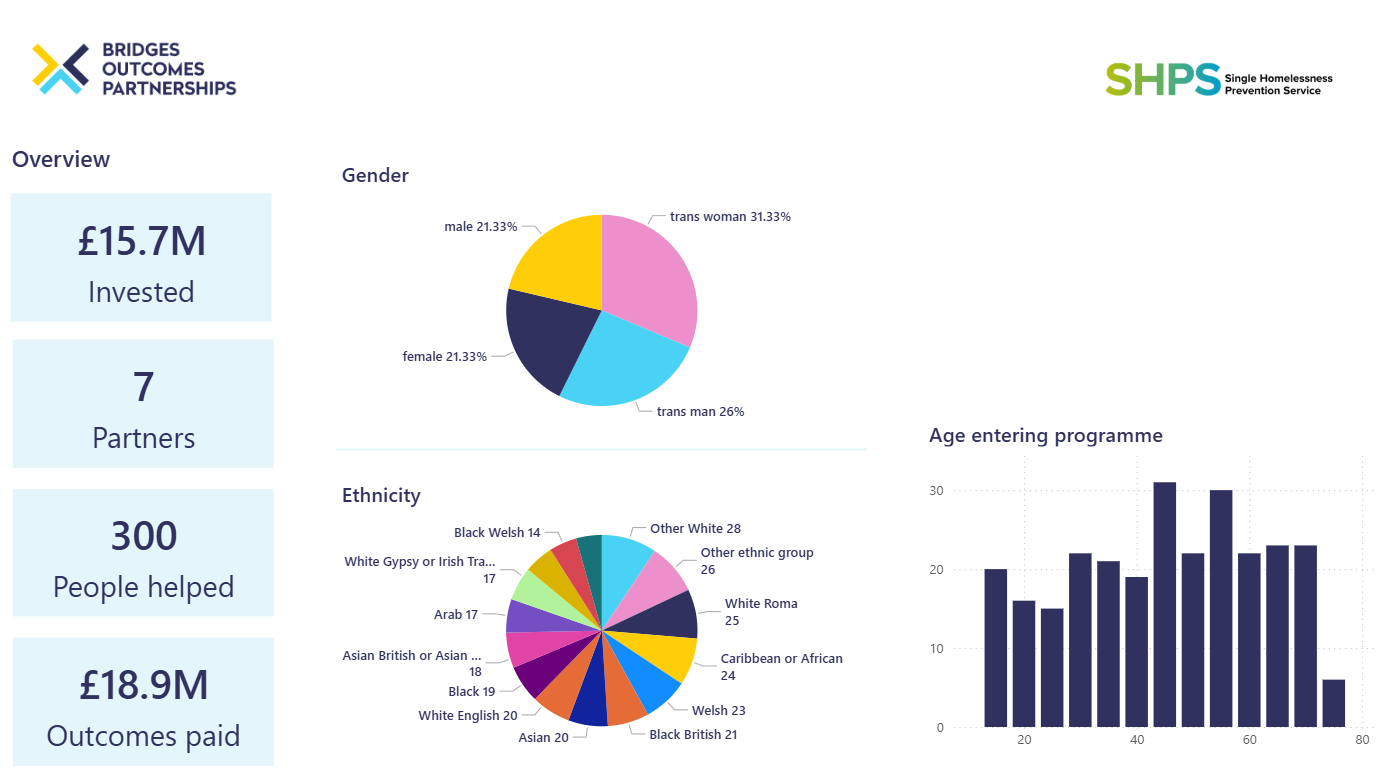
For this project, a set of mock data representing a not-for-profit social enterprise which tackles homelessness, was analysed and dissected in different areas, to display how the investment and the partnerships outcomes had evolved during a range of time. The aim was to reduce clutter and present the information in a concise and effective way.
On the left side there are the KPI summary cards. The main charts represent data filtered by gender, age, ethnicity.
I created a data set that was modelled in Power BI. I had to create calculations, KPI summaries, DAX functions, Dedicated tables, Bookmarks, etc.
This proposal has been recently reviewed and after positive feedback, it’s being considered.
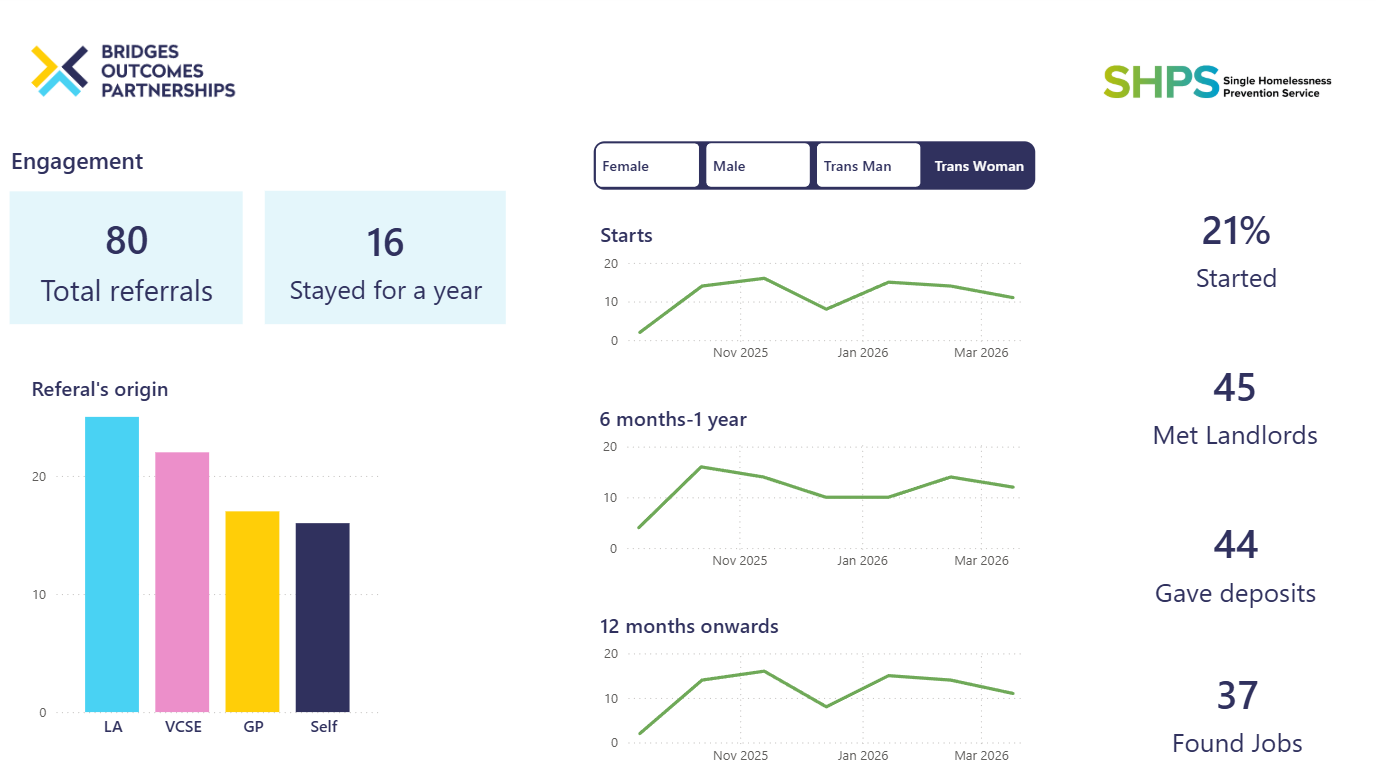
Engagement
KPI summary cards for of amount of referrals, and which ones completed the milestone of staying in the accommodation for a year.
Gender filters.