ECommerce Project
Overview
This project consists of many queries based on real case scenarios, it showcases the ability to analyze eCommerce data about website activity, products, orders and refunds.
Using MySQL to send queries and retrieve data I was able to understand and prove how customers access and interact with a site, analyzing landing page performance and conversion, as well as exploring product-level sales.
Traffic Source Analysis
An exploration on where costumers are coming from and which channels are driving the highest quality traffic.
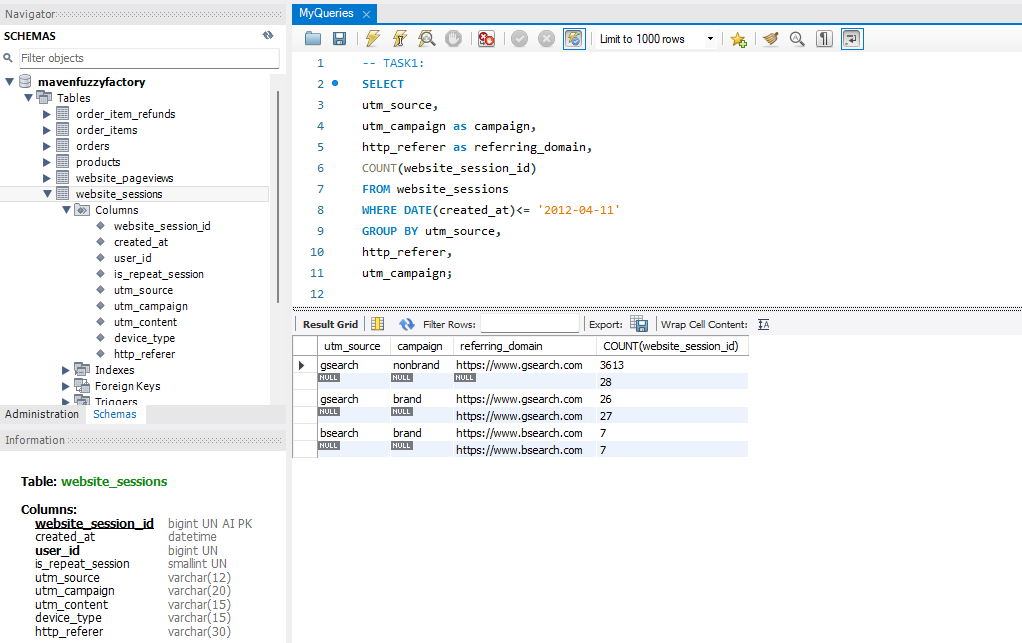
For the first task, I needed to find the bulk of the website sessions, during April 2012, sorted by UTM source, campaign and referring domain. This query returned the clear winner ‘gsearch nonbrand’, a whooping 3K visitors!
Engagement
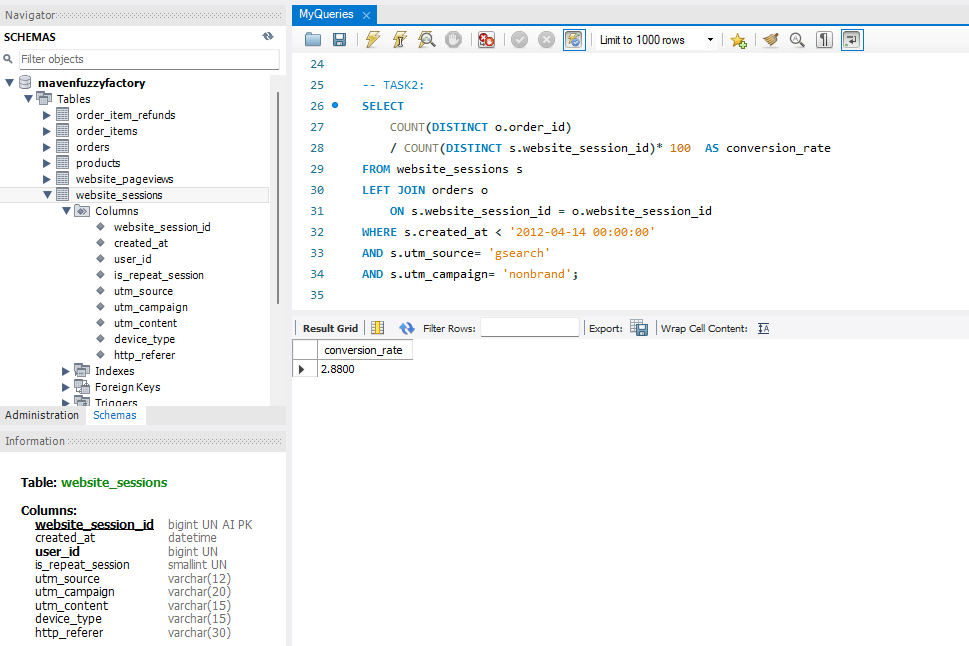
Despite of these promising results, we needed to find out if those sessions were driving sales. I had to calculate the conversion rate (CVR) from session to order. Depending on the results (at least 4%) there would be an increase or decrease on bids to drive more volume.
Bid optimisation
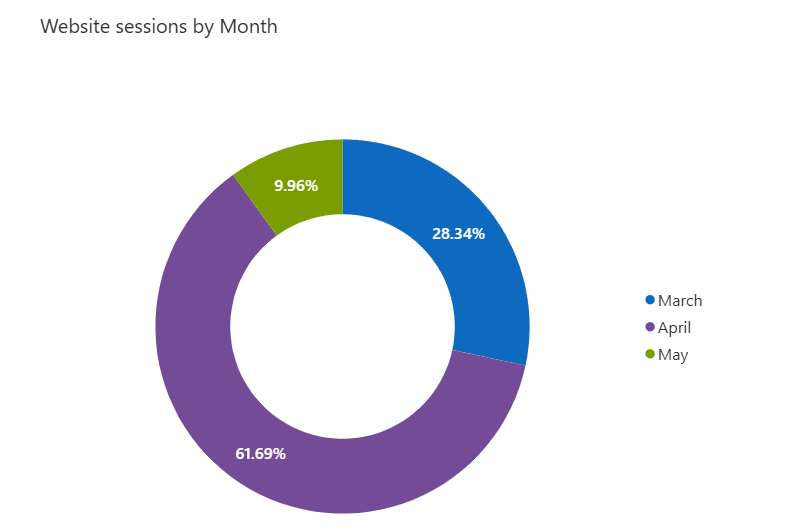
Based on my conversion rate ‘gsearch nonbrand’ was bid down on the 15th of April. I was asked to pull trended sessions by volume, sorted weekly, to see if the bid caused the volumes to go down.
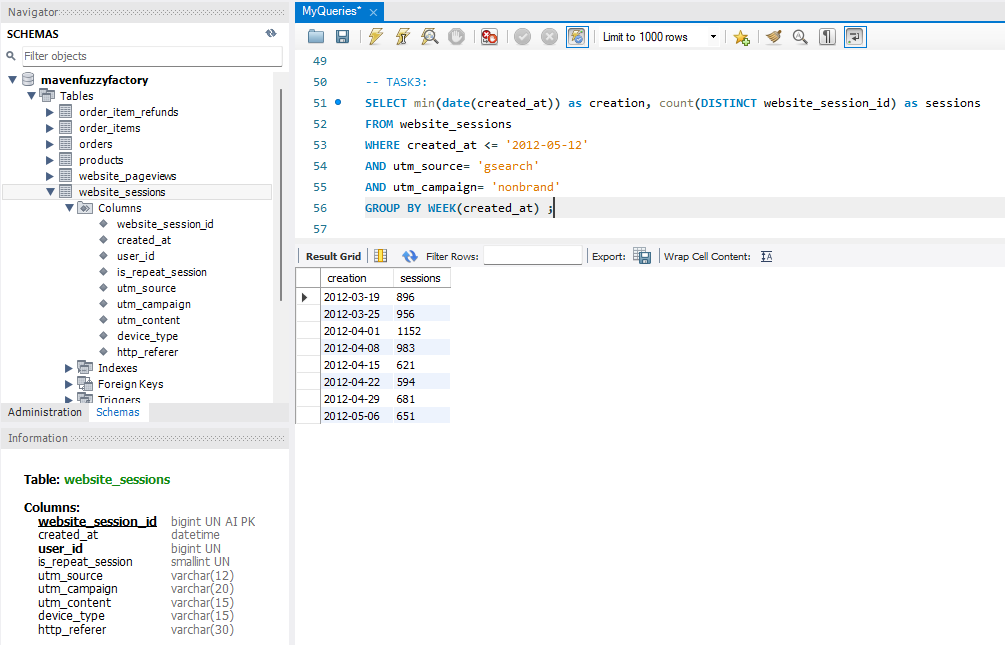
From the data gathered, I created some visual representation in Power BI to display the findings more clearly.
Device performance
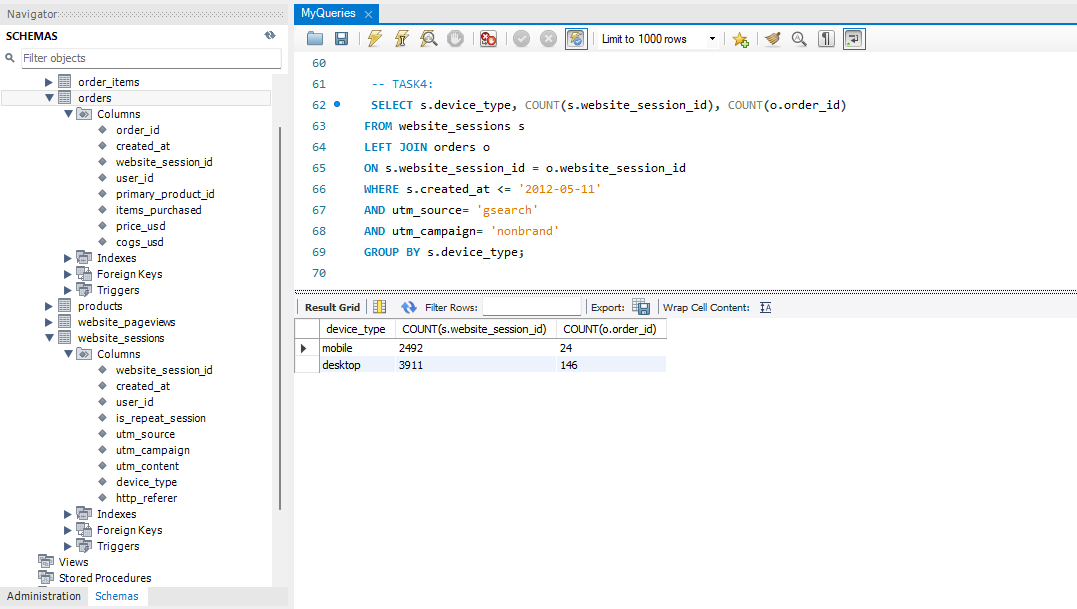
The user experience on mobile was reported to be deficient, so I was asked to compare the conversion rates from sessions to orders in both desktop and mobile. Based on this information, they would decide wether to bid up on desktop to get more volume.
Device-level trends
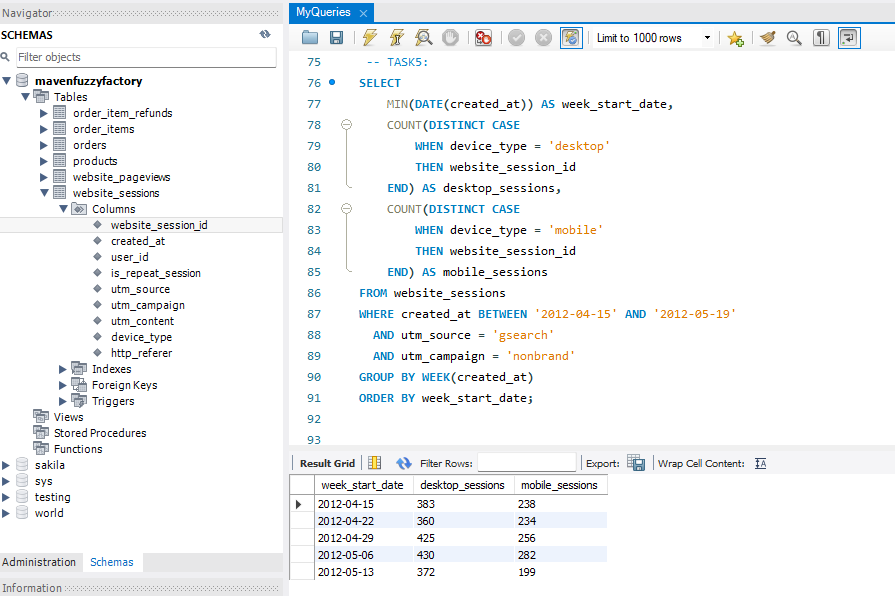
After my analysis of conversion rates, it was clear that desktop was doing well, so was bid up on May 19th. I was asked to retrieve weekly trends for desktop and mobile so they could see the impact on volume from April 15th.
To do this I had to pivot the device_type values (mobile and desktop) into separate columns instead of having them appear as rows.
Analysing top website content
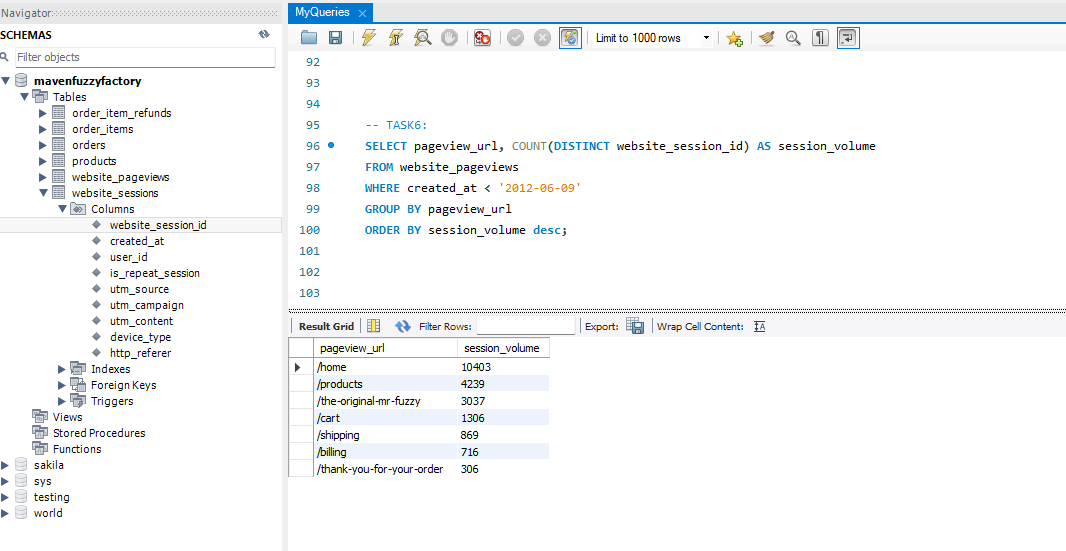
To let the Website Manager know the site stats, I retrieved information from the most-viewed website pages, ranked by session volume, the query was adjusted to the mock dates suggested.
Landing page Performance & Testing
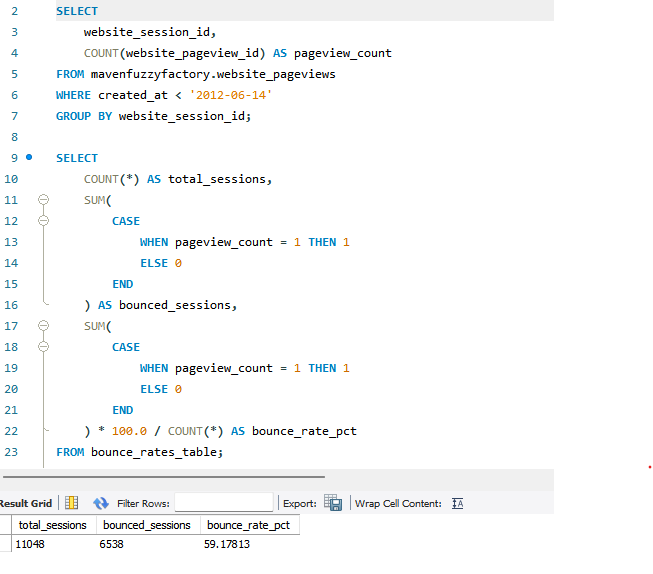
Since most of the traffic was coming from the home page, bounce rates were analysed to find the percentage and the totals. Creating a temporary table, bounce_rates_table, I was able to obtain that information. The result was a 59% bounce rate.